Choosing where to take your driving test is a decision that many learners overlook, yet it can have a real impact on your chances of success. Driving test centre pass rates vary significantly across the UK, and understanding what those numbers actually mean could give you a genuine edge before you ever sit behind the wheel on test day.
If you are based in or around Bromley, this data is especially worth paying attention to. Some test centres record pass rates well above the national average, while others consistently fall below it. But raw statistics only tell part of the story. Factors such as local road complexity, examiner consistency, and even the time of year all play a role in shaping those figures.
In this post, we break down the driving test centre pass rates relevant to Bromley learners in plain, straightforward terms. You will learn how to read the data correctly, what it suggests about your local options, and how to use this information to make a smarter, more informed decision about where to book your test.
UK National Average Driving Test Pass Rate
According to the DVSA’s official statistical dataset for driving and theory tests, last updated 17 July 2026, the UK national average practical driving test pass rate stands at 47.9% across 297 test centres. Put simply, fewer than half of all candidates pass on their first sitting. That single figure carries considerable weight, yet it only tells part of the story. Knowing the national average gives you a benchmark, but it cannot tell you what to expect at your local test centre, which may perform significantly above or below that threshold.
The variation across centres is striking. UK driving test pass rates by centre show the lowest recorded pass rate of just 34%, shared by Wolverhampton and Featherstone, while the Isles of Scilly tops the table at 88%. That is a 54-percentage-point gap between the best and worst performing centres in the country. Geography plays a defining role here. Rural and remote centres consistently outperform busy urban ones, largely because quieter roads present fewer hazards and complex junctions during a test. Nine of the top ten performing centres are located in Scotland. By contrast, high-density urban environments with complex road layouts tend to produce lower pass rates.
This growing disparity has captured significant public attention. A Channel 4 News video published in December 2024 covering test centre pass rates attracted over 10,000 views, demonstrating genuine public demand for transparent, centre-level data. Commentators have described the situation as a postcode lottery, and it is easy to see why. Understanding the national average is your essential starting point, but the figures that matter most to you are those attached to the specific centres where you are likely to sit your test.
Why Do Pass Rates Vary So Much Between Test Centres?
The single most important factor driving variation between test centres is the complexity of the surrounding road network. Examiners across Great Britain apply an identical DVSA marking system, using the same criteria for minor, serious, and dangerous faults at every centre. The roads present the difficulty; the examiner does not create it. Understanding this distinction is essential before drawing any conclusions from pass rate figures.
Rural and remote centres consistently sit at the top of the national league table. The Isles of Scilly records a pass rate of around 88%, and Arbroath reaches approximately 79%. Learners at these centres navigate quieter roads, simpler junctions, and lower traffic volumes throughout their test. Fewer decisions per minute means fewer opportunities to record a fault, and that structural advantage is reflected directly in the statistics. It is worth noting, however, that some top-ranked rural centres conduct very few tests each year, which makes their figures statistically volatile. A single extra pass or fail can shift the percentage substantially.
Urban centres face the opposite conditions. Candidates tested in busy cities encounter multi-lane roundabouts, bus lanes, complex junctions, and high-density traffic within the first few minutes of their test. According to research into rural versus urban pass rates, inner-city centres average just 41.7%, compared to 51.0% for rural centres. As further analysis confirms, higher traffic volume creates more decisions, and more decisions create more opportunities for examiners to record a fault.
A common misconception follows from this data: that booking a rural centre guarantees a better outcome. In practice, the opposite can be true. A learner trained entirely on south-east London roads will have developed the skills to handle dense urban traffic, complex junctions, and busy one-way systems. Sitting a test on unfamiliar single-track rural roads, having never practised those specific routes, removes the familiarity that is one of the strongest predictors of passing. Road knowledge and preparation are inseparable from performance on test day.
The practical takeaway is clear: a lower pass rate at your local centre reflects the difficulty of the roads surrounding it, not the quality of instruction available in your area.
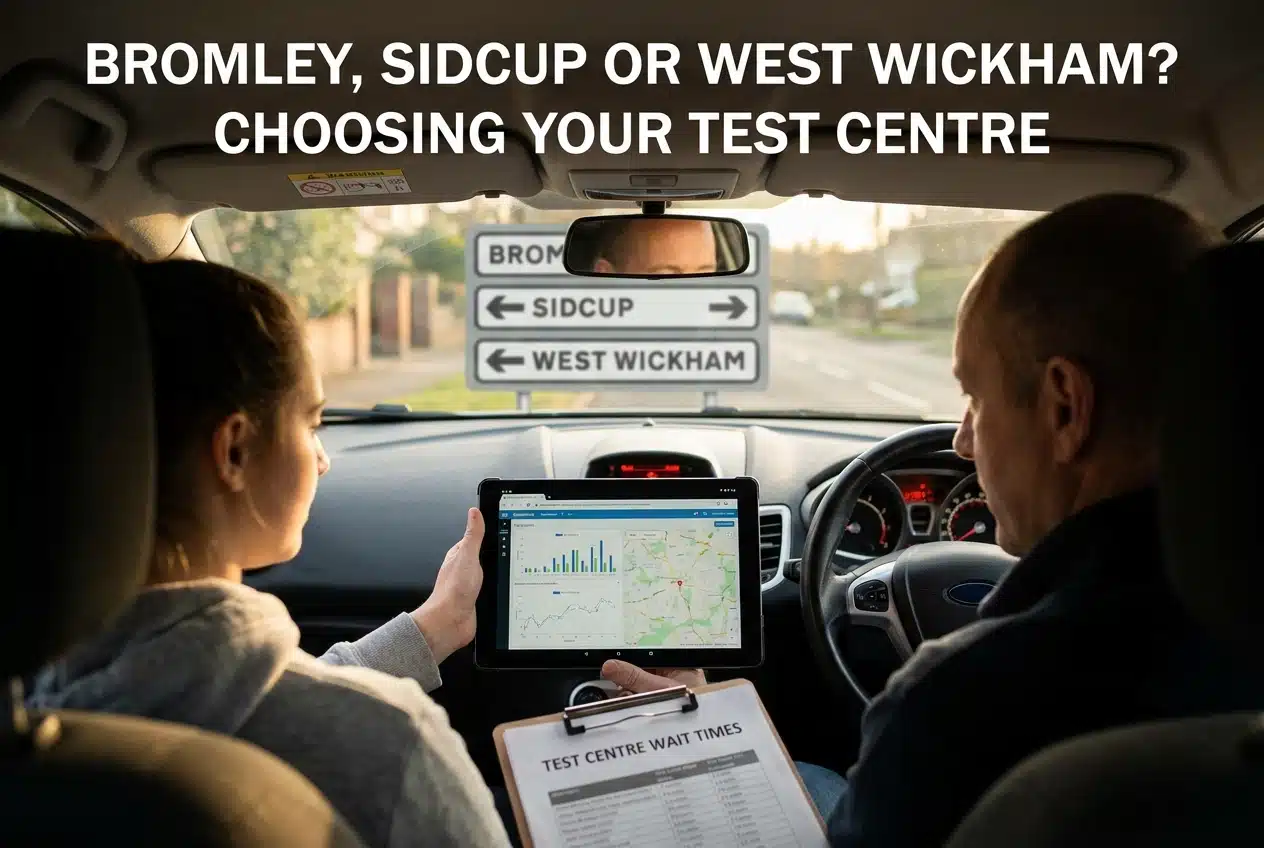
Bromley, Sidcup and West Wickham: What the Local Data Shows
For learners based in Bromley and the surrounding south-east London area, the local pass rate data is genuinely encouraging. Bromley test centre, located on Burnt Ash Lane in BR1, records a 52% pass rate in the current dataset, placing it comfortably above the 47.9% national average and among the top performers across all London centres. That figure matters whether you hold a BR1, BR2, BR3, or BR4 postcode, because it reflects the real-world outcomes being achieved by learners sitting their practical test on these roads. In a city where many test centres fall well short of the national average, a 52% result represents a meaningful advantage for local candidates.
Sidcup, which serves a significant portion of south-east London, goes further still. At 58%, it is the highest-performing test centre across the entire London network in the current dataset, a result that reflects the relatively manageable road environment in that part of the city compared to more congested inner-London routes. That said, Sidcup’s strong record comes with a practical consideration: typical wait times there are notably longer than at neighbouring centres, something worth factoring into your test booking timeline.
West Wickham rounds out the south-east London picture with a 51% pass rate, also above the national average, and importantly offers a much shorter typical wait than Sidcup. Together, these three centres demonstrate that south-east London as a cluster genuinely outperforms much of the wider London network.
To understand what that means, it helps to see the contrast clearly. The table below compares the key local centres against some of London’s weaker performers:
| Test Centre | Pass Rate |
|---|---|
| Sidcup | 58% |
| Bromley | 52% |
| West Wickham | 51% |
| Erith | 49% |
| Belvedere | 37% |
Belvedere records just 37% and Chingford 36%, placing both among the lowest results anywhere in London. Erith, at 49%, sits close to the national average. The variation across these centres, all within the same city, underlines a point worth taking seriously: where you sit your test has a measurable bearing on your statistical likelihood of passing. Learners preparing in south-east London are, on the available evidence, starting from a stronger position than many of their counterparts elsewhere in the capital.
Automatic vs Manual Pass Rates: What the DVSA Data Reveals
Beyond the combined pass rate figures that most sources report, the DVSA publishes a dedicated dataset specifically for automatic car driving tests, broken down by individual test centre. This file, referenced as drt122e within the broader DVSA driving and theory test statistical release, offers a level of granularity that general pass rate comparisons simply cannot provide. For learners taking an automatic test, relying solely on combined figures means working from data that includes a large volume of manual tests, which may not accurately reflect conditions relevant to their own preparation.
One important caveat is that automatic test volumes at any single centre are substantially lower than manual volumes. Because the sample sizes are smaller, year-on-year percentage figures can shift more noticeably, even when underlying conditions remain consistent. This statistical volatility does not mean the data is unreliable; it means it should be read as a directional indicator rather than a fixed benchmark. Across several years, the data still paints a meaningful picture for local learners who want to understand what to expect at centres such as Bromley or Sidcup.
The demand for automatic tests has grown considerably in recent years. In 2012/13, automatics accounted for roughly 6% of all driving tests taken in the UK. By 2024/25, that figure had risen to 26%, with projections suggesting it will reach 29% in 2025/26. The AA Driving School’s forecast that one in four passes would be in automatics by 2026 has now been confirmed by DVSA data. Two factors are driving this shift: the UK’s transition toward electric vehicles, which have no manual gearbox, and the well-documented reduction in test-day cognitive load that comes from not managing a clutch. Fewer things to coordinate means fewer opportunities for nerves to cause errors.
For learners training with EL’s Driving School, which specialises exclusively in automatic driving lessons, this data is directly practical. Understanding automatic-specific pass rates at Bromley and nearby centres supports realistic goal-setting and helps learners judge when they are genuinely test-ready. Third-party aggregator sites currently present only combined pass rate figures. To access automatic-specific results at a local centre level, the drt122e ODS file from the DVSA remains the most reliable and authoritative source available.
How Long Will You Wait for a Test in South-East London?
Pass rates are only part of the picture for learners planning their practical test. Understanding how long you will actually wait for an appointment is equally important, and until recently the official data was significantly misleading.
In June 2026, the DVSA introduced enhanced monthly waiting time data, publishing median waiting times between booking date and test date for every test centre in Great Britain. This replaced the previous “10% availability” metric, which measured how far ahead you had to look before 10% of weekly slots remained bookable. That older figure was widely mistaken for an average wait time, but it was not. The gap between the two measures proved substantial in practice.
At Darlington in May 2026, the old measure indicated a 13-week wait. The true median was just 6.7 weeks. That is nearly half the figure learners were previously relying on for their planning. The DVSA acknowledged the distortion directly following a National Audit Office investigation into car driving test waiting times, which found the old metric did not reflect how long learners actually waited. The DVSA confirmed the reform was a direct response to that NAO recommendation, signalling that test centre transparency is now under active regulatory scrutiny.
For learners in Bromley and south-east London, this matters immediately. London as a region carries some of the longest waits in England, with Sidcup noted among centres operating near the 24-week maximum on both measures as of May 2026. Checking the monthly DVSA statistical release, updated on the second Wednesday of each month, is now the most reliable way to understand current availability at Bromley, Sidcup, and West Wickham specifically.
The practical lesson is straightforward: book your test as early as you are eligible, ideally straight after passing your theory test. Use the waiting period productively with additional lessons, hazard perception practice, and mock tests. Longer lead times are an opportunity, not a setback.
Does Your Driving School Choice Affect Your Pass Rate?
The pass rate figures published for Bromley, Sidcup, and West Wickham tell you something genuinely useful about local road conditions and test difficulty. What they cannot tell you is how well any individual driving school or instructor prepares its pupils. This distinction matters enormously for learners making decisions about their training. The DVSA collects and publishes pass rate statistics at test centre level, aggregating the results of every candidate who sits a test at that location. Those figures reflect cumulative outcomes shaped by road complexity, traffic patterns, and examiner routes, not the quality of instruction received by any individual learner.
What actually determines whether you pass first time comes down to the quality and quantity of your preparation. The DVSA recommends approximately 45 hours of professional tuition, and its own Ready to Pass campaign attributes most first-test failures not to the difficulty of the test itself, but to candidates booking before they have genuinely reached test standard. Structured lesson hours, deliberate practice on the specific routes examiners use, regular mock tests, and honest feedback from an instructor who knows the local roads are the preparation factors with the clearest evidence behind them. A learner who works through these steps systematically is far better placed for first-time success than one who simply picks a test centre based on its headline pass rate.
This is where local route knowledge becomes a meaningful practical advantage. An instructor who has prepared pupils at Bromley, Sidcup, and West Wickham over many years develops a detailed understanding of the junctions, manoeuvre locations, and traffic conditions that appear consistently on test day. That experience cannot be replicated by an instructor working in an unfamiliar area, regardless of their general teaching ability.
EL’s Driving School has been operating in Bromley since 2004, giving its instructors more than two decades of continuous experience with the test routes most relevant to BR1, BR2, BR3, and BR4 learners. That accumulated local knowledge is built directly into how lessons are structured and how pupils are prepared for their practical test. Combined with structured mock test practice and specific feedback on the fault categories the DVSA flags most frequently, this approach is designed to close the gap between a learner’s current ability and genuine first-time pass readiness.
What to Do If You Do Not Pass First Time
With a national average pass rate sitting at 47.9%, the statistical reality is straightforward: the majority of driving test candidates do not pass on their first attempt. The DVSA’s own Ready to Pass campaign has confirmed that roughly 50 out of every 100 tests result in a fail. This is not an exceptional outcome. It is the most common one. Understanding this reframes what a first-time fail actually means: it is a data point about readiness on a specific day, not a definitive verdict on your ability to become a safe and competent driver.
Use the Test Report as Your Starting Point
The single most valuable thing you receive after an unsuccessful test is the examiner’s verbal debrief, accompanied by the DL25 marking sheet. This document itemises every fault recorded during your drive, categorised as minor, serious, or dangerous. A serious or dangerous fault at any point is an automatic fail, while 16 or more minor faults also results in a fail. The DL25 is not a critique; it is a diagnostic tool. Share it with your instructor immediately after your test, before the details of the debrief begin to fade. The fault categories recorded, whether related to junctions, mirror checks, or manoeuvres, form a direct roadmap for your preparation before rebooking.
Rebook Strategically, Not Immediately
You can legally rebook a practical test as soon as three working days after a fail, subject to availability. However, the minimum permissible gap and the advisable gap are two different things entirely. Rebooking quickly without addressing the specific faults identified in your report is likely to produce the same outcome. A structured block of refresher lessons targeted precisely at those fault categories is a far more productive use of your waiting period than simply adding general driving hours.
Given that Bromley and West Wickham both record pass rates above the national average, a well-prepared candidate who has genuinely addressed the reasons for an earlier fail enters a retest at either centre with a solid, evidence-based foundation for confidence.
Frequently Asked Questions
What is the pass rate at Bromley test centre?
Bromley test centre records a 52% pass rate, placing it above the UK national average of 47.9% and among the stronger performers across London. For learners in the BR1, BR2, and surrounding areas, this is a meaningful advantage. Lower-performing nearby centres such as Belvedere (37%) offer a useful point of comparison.
Is Sidcup a good test centre?
Yes. Sidcup records a 58% pass rate, making it the highest-performing test centre in London within the current DVSA dataset. That figure sits comfortably above both the London average and the national average of 47.9%. For well-prepared learners in that area, this is a positive statistical indicator, though preparation quality remains the most important factor in any individual outcome.
Why are rural test centres easier to pass at?
Rural centres consistently dominate the upper end of the national pass rate table. The Isles of Scilly leads at 88%, with Arbroath close behind at 79%. These figures reflect lighter traffic volumes, simpler road layouts, and lower-complexity routes rather than any difference in examiner standards. Examiners apply an identical national marking standard at every centre. Experts generally advise against travelling to a rural centre purely for a higher pass rate; learners perform best where they have trained.
How do I find the latest official DVSA pass rate data?
The DVSA publishes driving test centre pass rates with the latest DVSA data covering all Great Britain test centres on GOV.UK. The dataset was last updated 17 July 2026 and is refreshed periodically throughout the year. It remains the primary authoritative source for accurate, up-to-date figures.
Does taking an automatic test affect my chances of passing?
The DVSA publishes a separate dataset specifically for automatic car driving tests, broken down by individual test centre. Pass rates within that dataset can differ from the combined manual and automatic figures reported in headline statistics. With automatic vehicles growing in popularity, this data is increasingly relevant. One important consideration: passing in an automatic vehicle restricts your licence to automatics only, so this choice carries long-term implications worth discussing with your instructor before booking.
Key Takeaways for Bromley and South-East London Learners
The data tells a clear and encouraging story for south-east London learners. Bromley (52%), Sidcup (58%), and West Wickham (51%) all sit comfortably above the UK national average of 47.9%, meaning you are starting from a more favourable position than learners at many centres across the country. Contrast this with areas like Belvedere at just 37%, and the local advantage becomes even more apparent.
It is equally important to remember what pass rates do not measure. These figures reflect road complexity and traffic conditions, not the quality of instruction you receive. Thorough preparation, genuine familiarity with local test routes, and well-structured mock tests will consistently matter more than which centre you select.
Planning your timeline is now more straightforward than before. The DVSA began publishing monthly median waiting time data from June 2026, giving you a far more accurate picture of how long to expect between booking and your test date. Book early, and use that window to consolidate your skills properly.
For learners across Bromley and the surrounding BR postcodes, EL’s Driving School brings over 20 years of local road knowledge to every automatic driving lesson. Contact the school to discuss a preparation plan tailored to your nearest test centre.